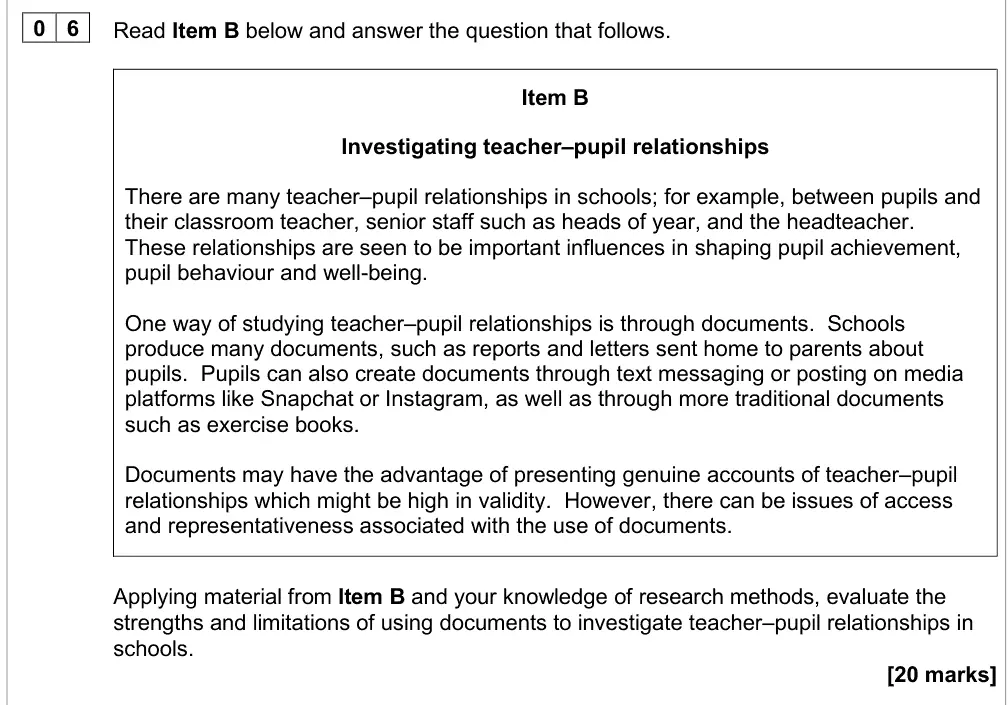
Applying material from Item B and your knowledge of research methods, evaluate the strengths and limitations of using documents to investigate teacher–pupil relationships in schools.
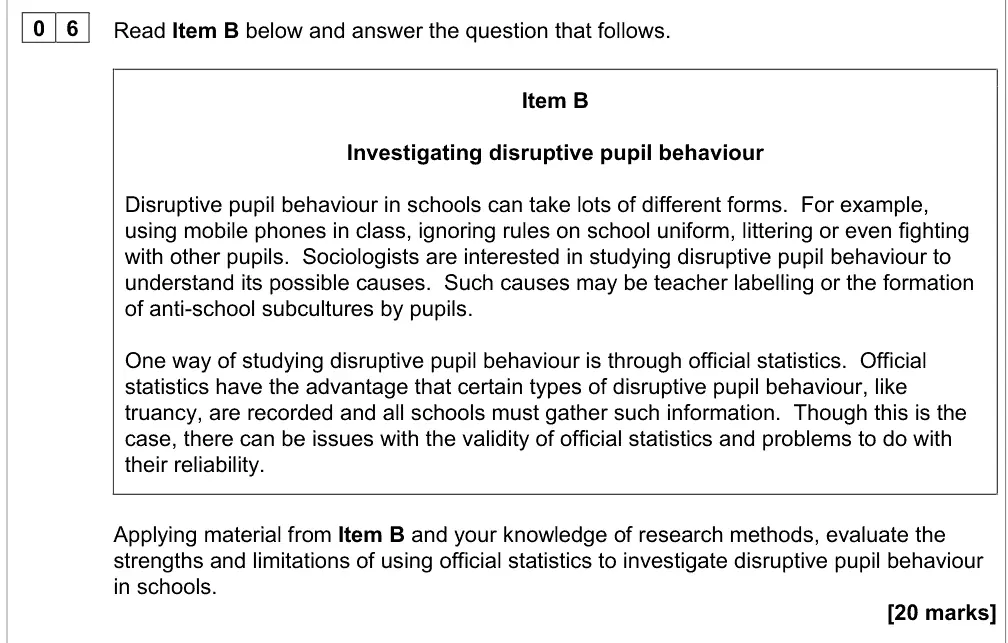
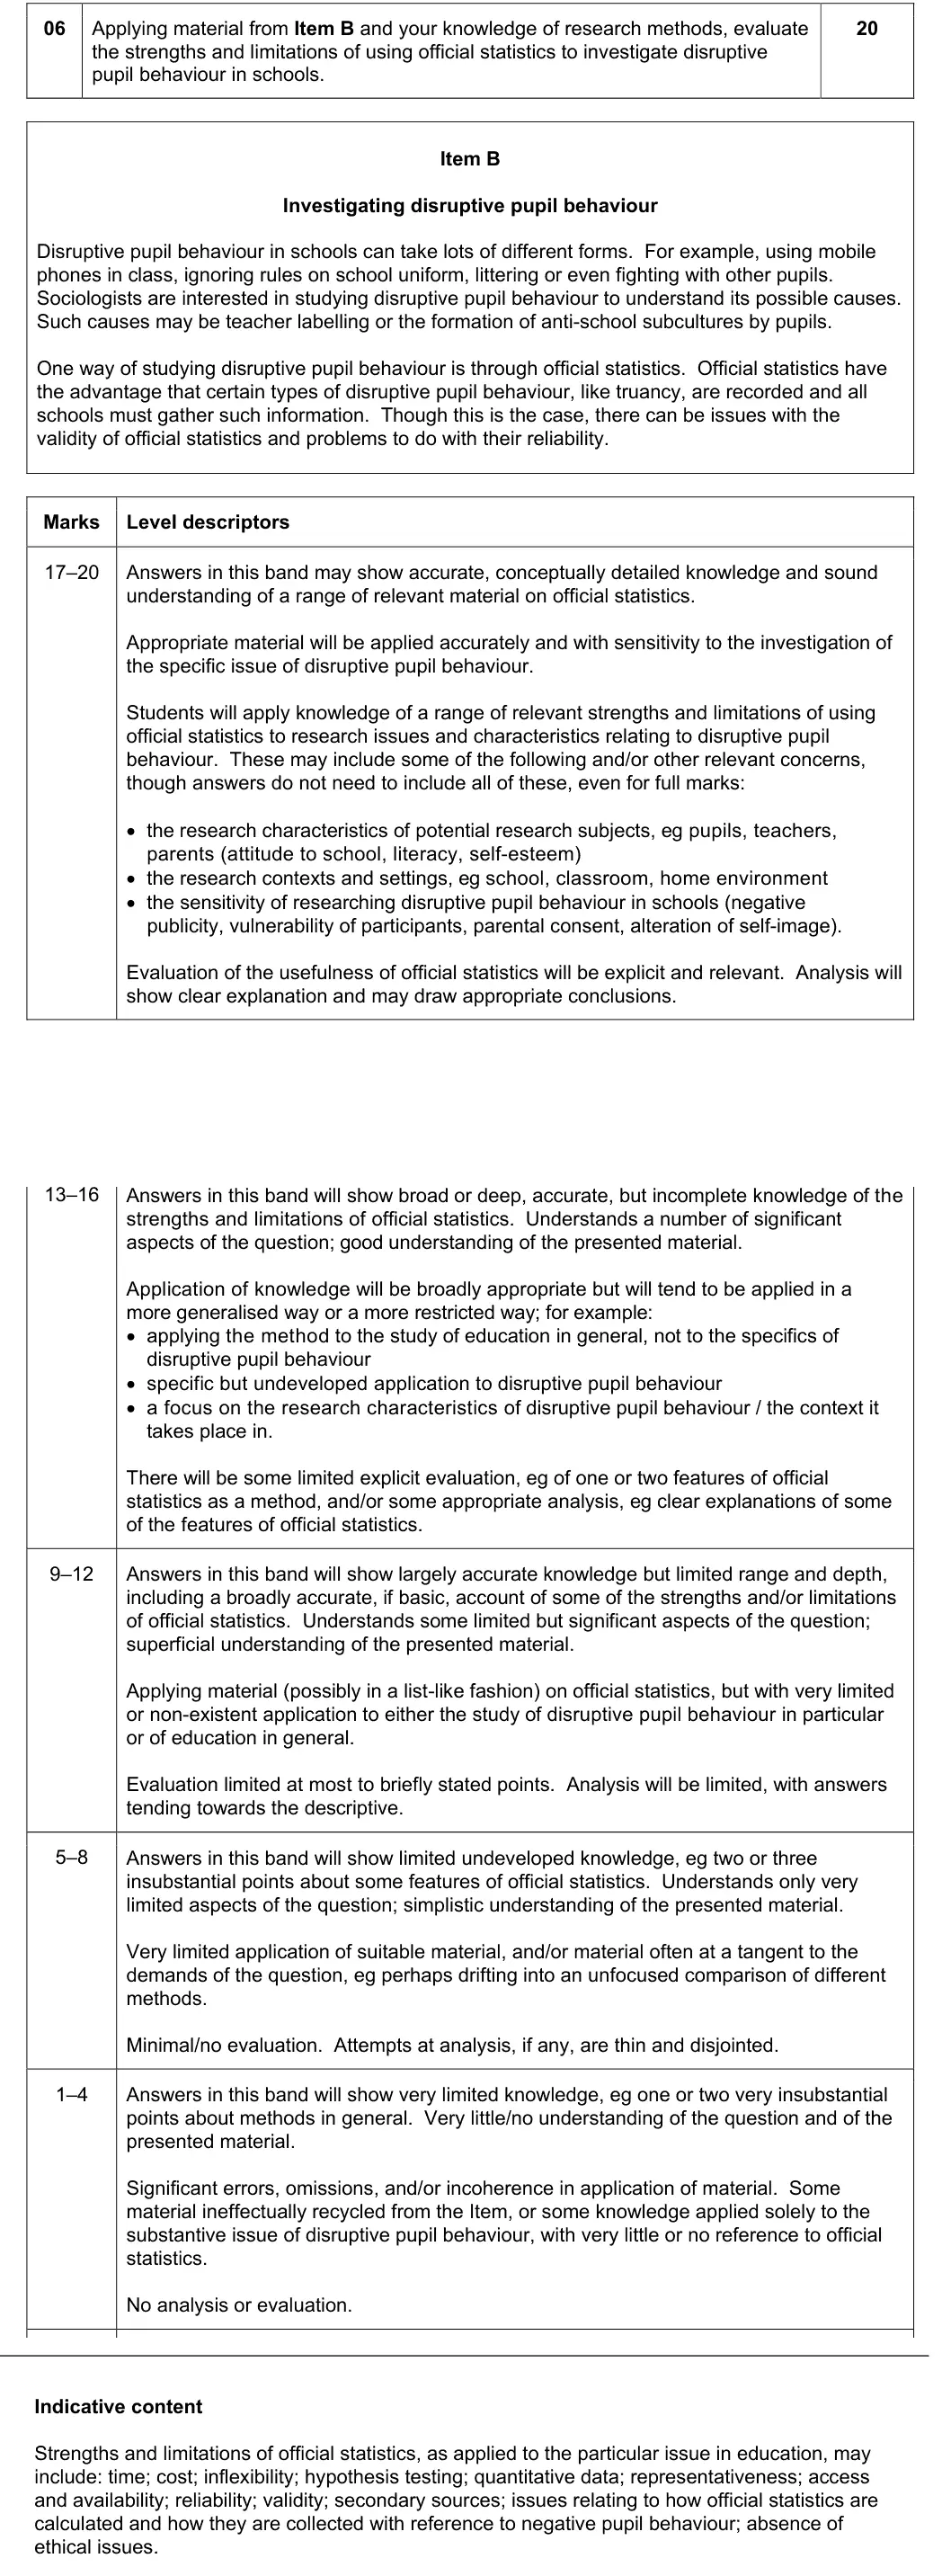
Applying material from Item B and your knowledge of research methods, evaluate the strengths and limitations of using official statistics to investigate disruptive pupil behaviour in schools.
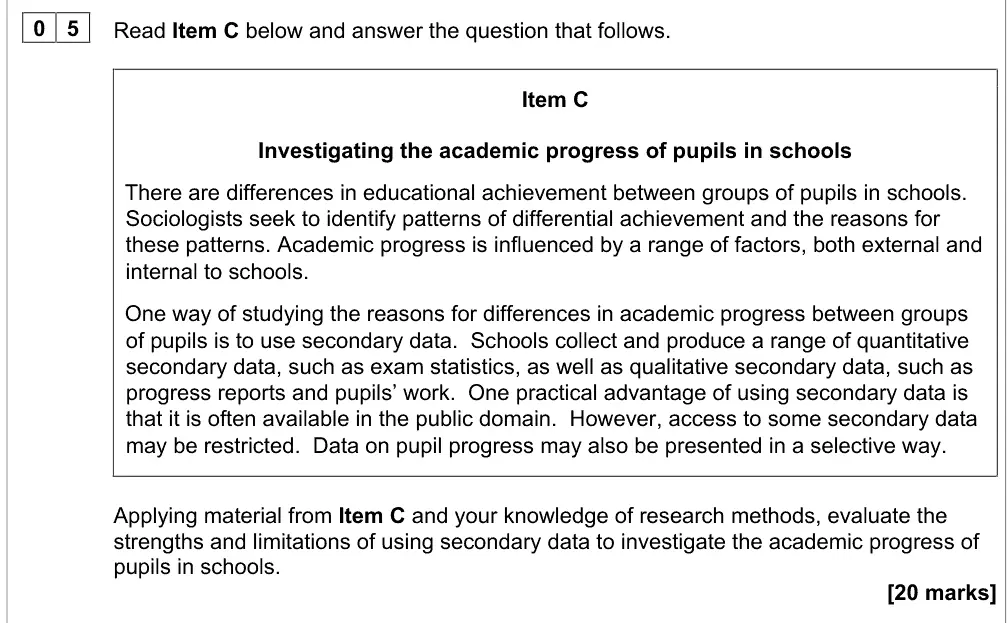
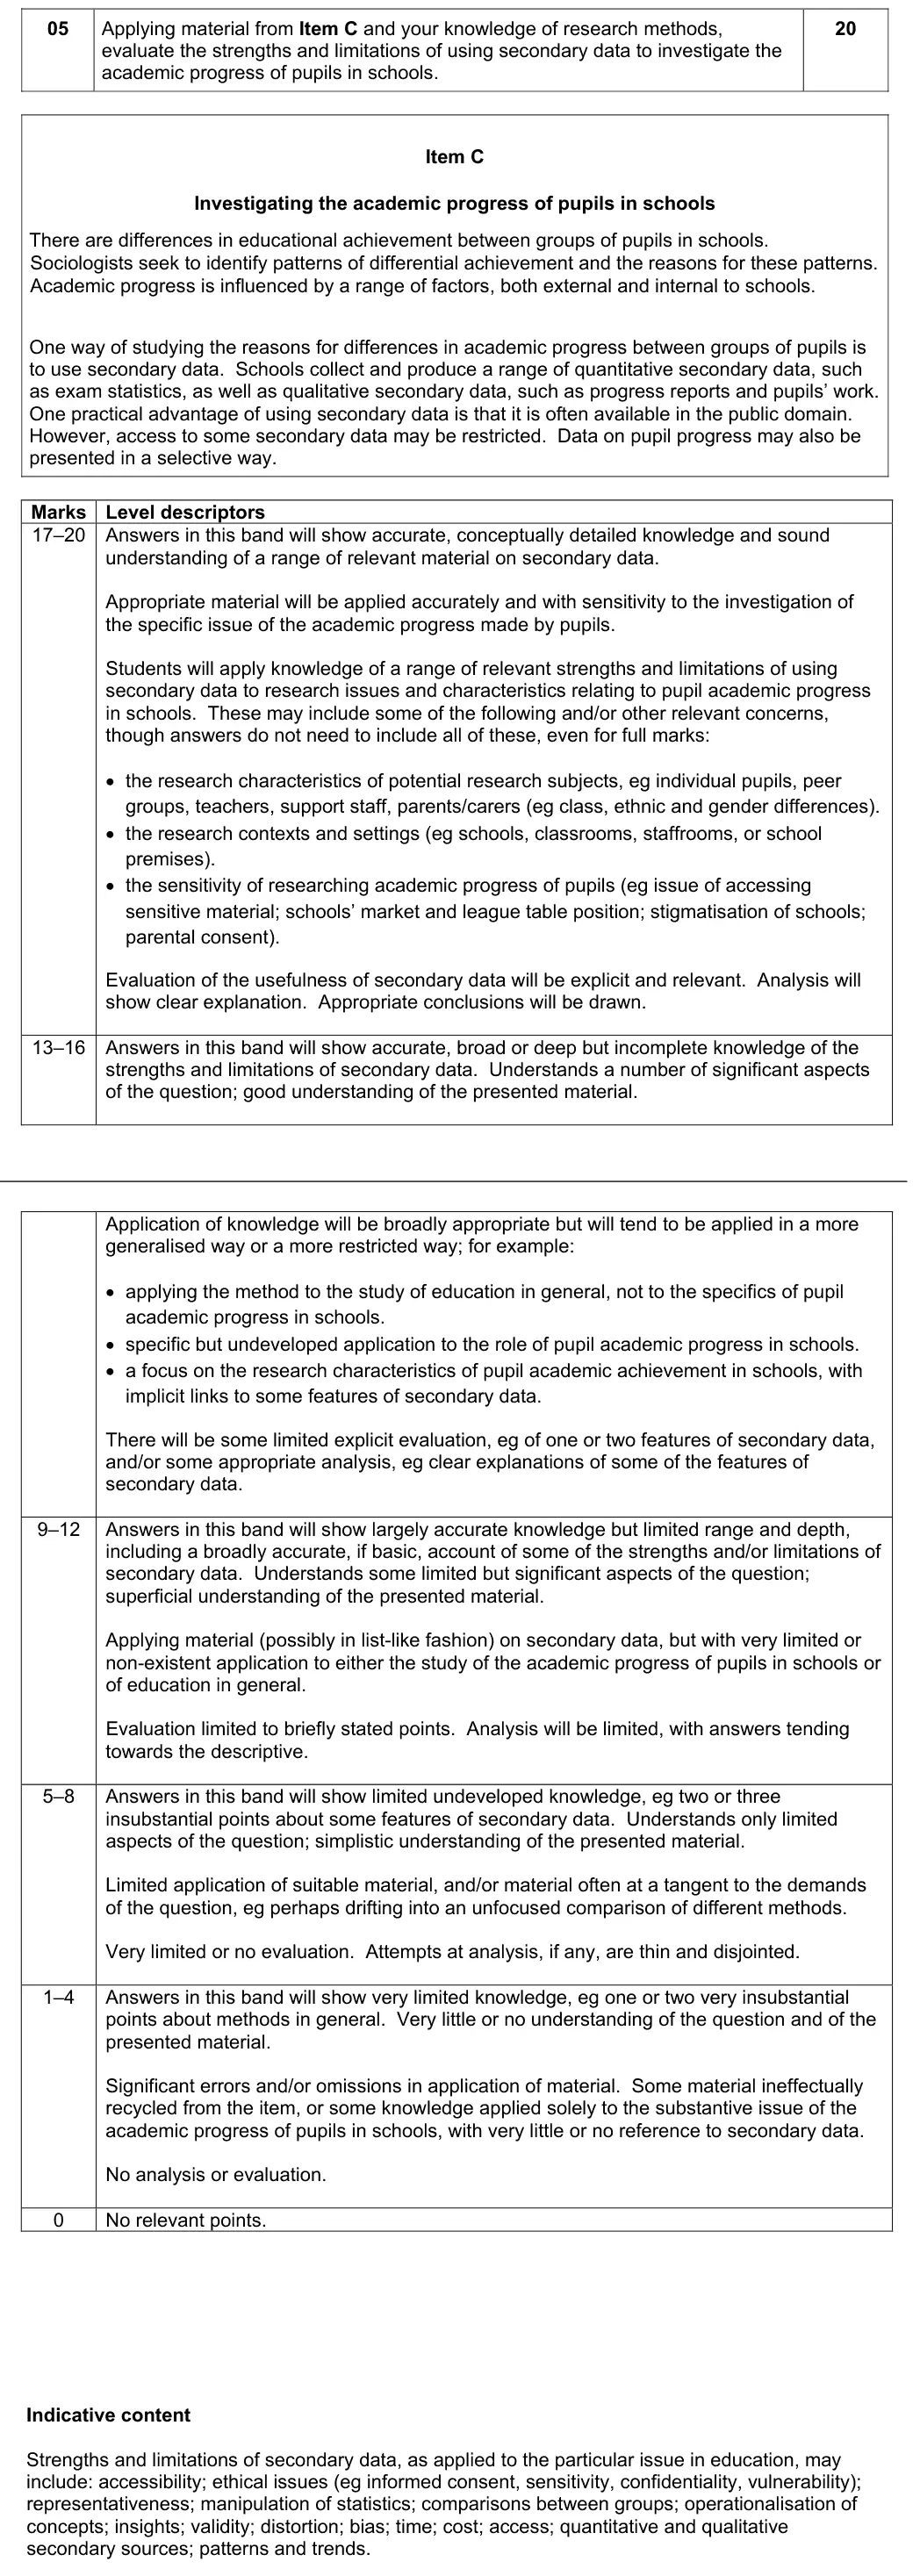
Applying material from Item C and your knowledge of research methods, evaluate the strengths and limitations of using secondary data to investigate the academic progress of pupils in schools.
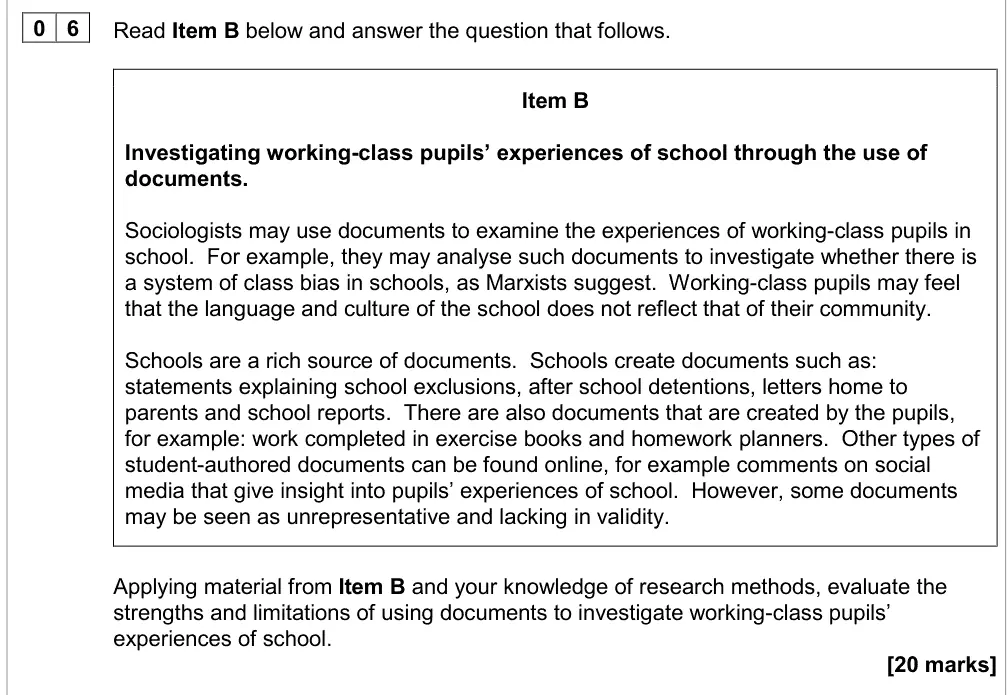
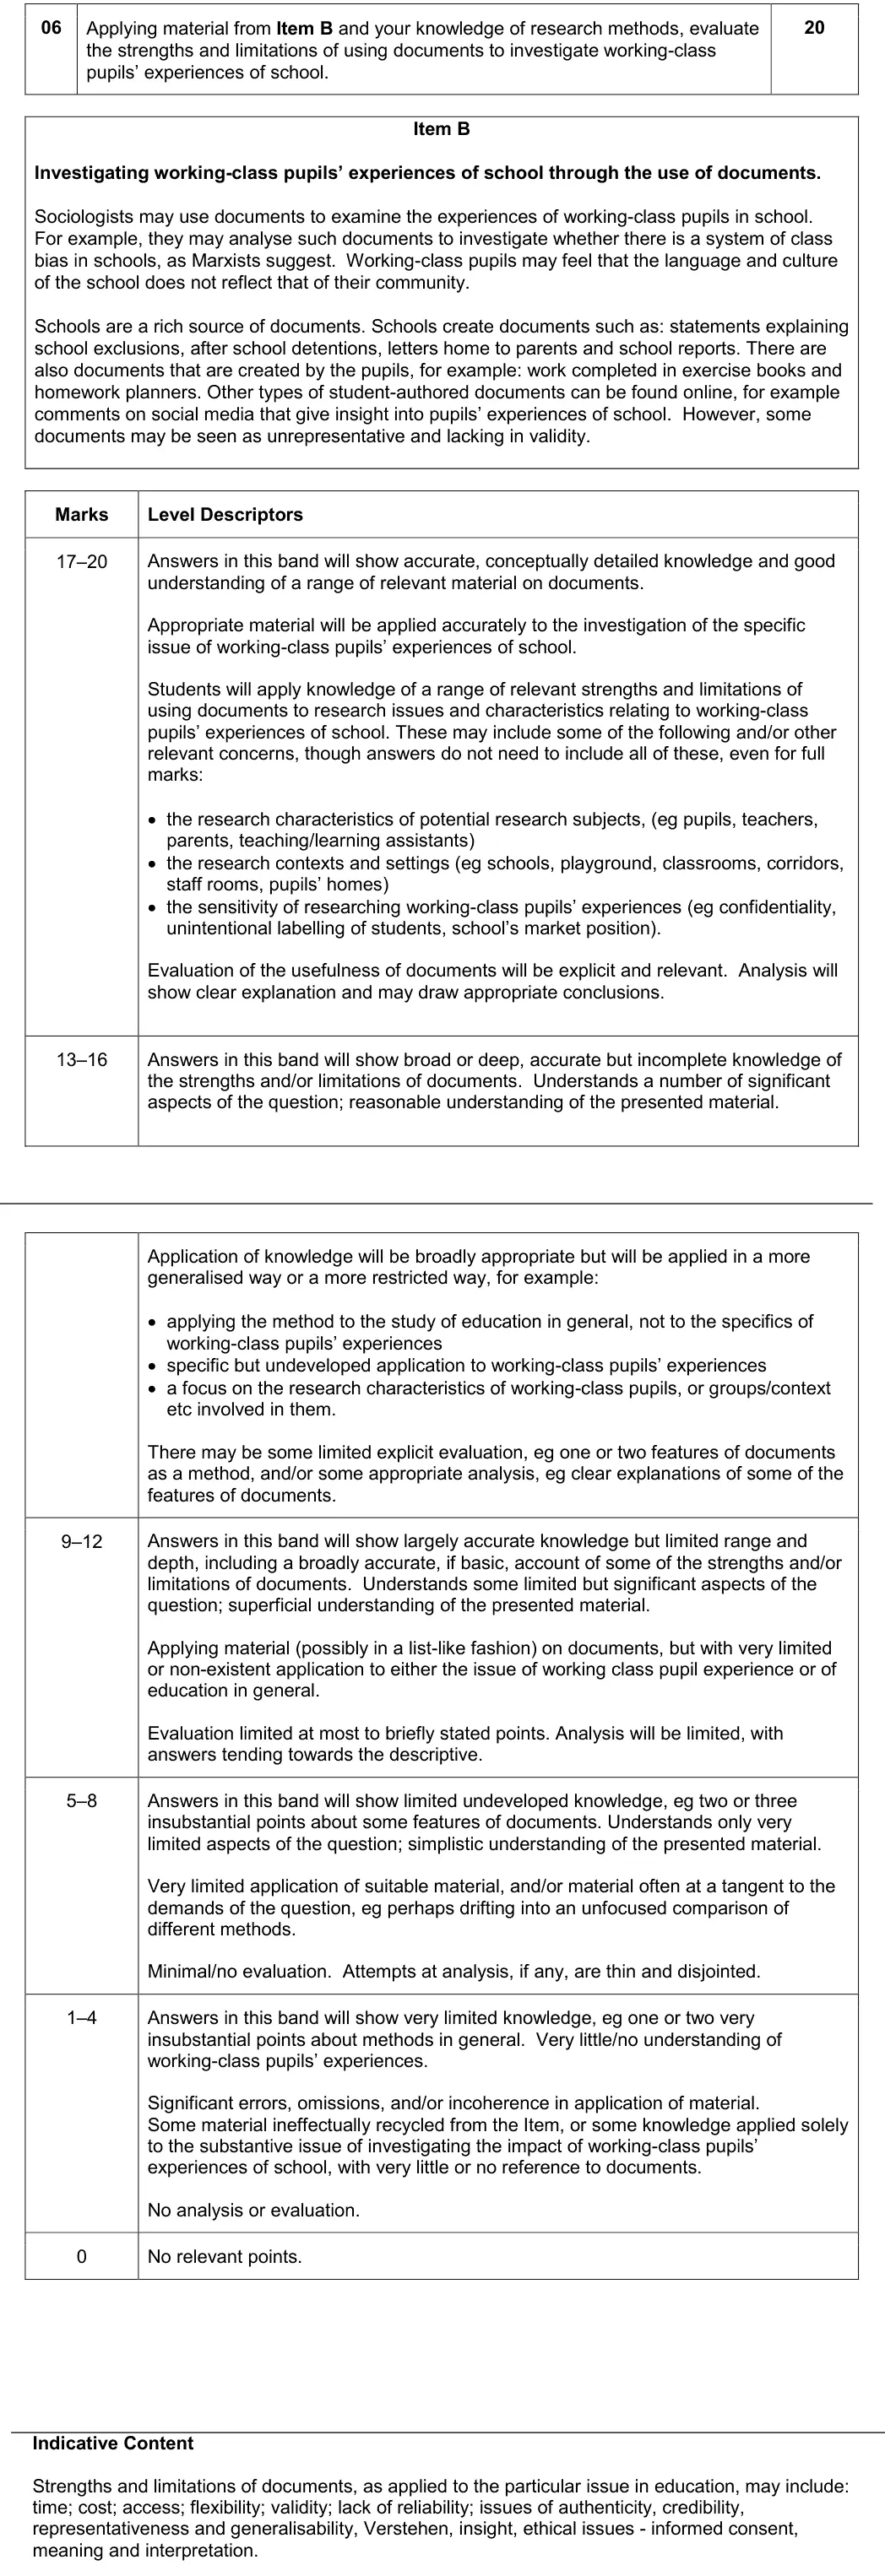
Applying material from Item B and your knowledge of research methods, evaluate the strengths and limitations of using documents to investigate working-class pupils’ experiences of school.
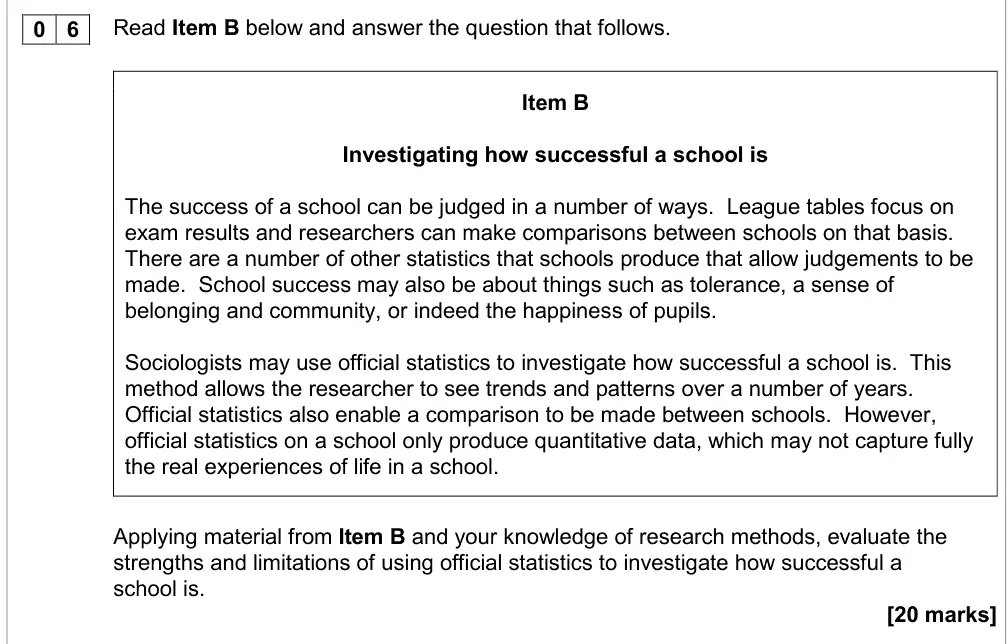
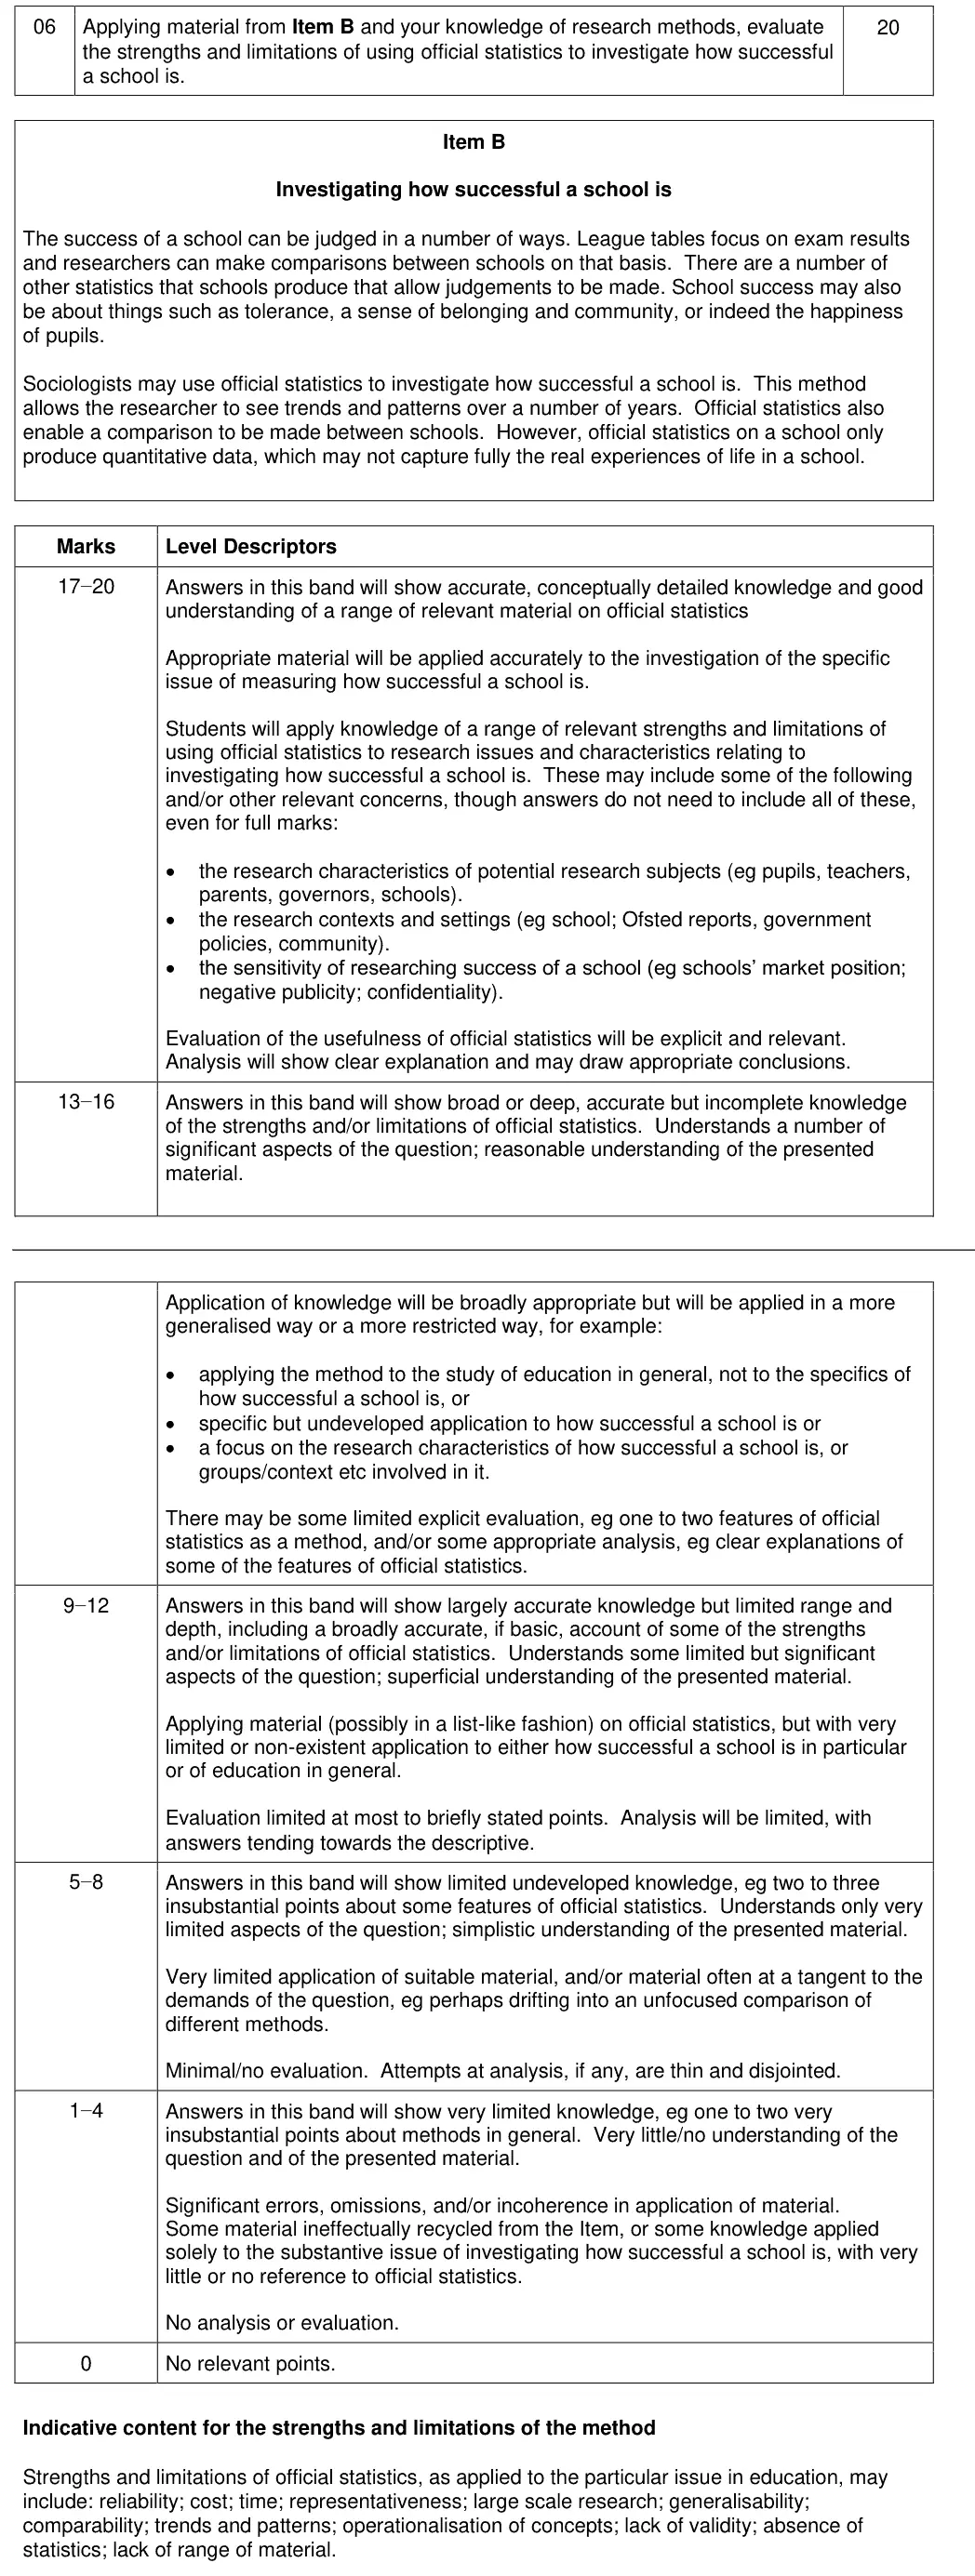
Applying material from Item B and your knowledge of research methods, evaluate the strengths and limitations of using official statistics to investigate how successful a school is.
Tap a question to zoom it. The mark scheme (with the level descriptors and indicative content) and the examiner's comment open underneath.
June 2025 · AS Paper 1 · Q620 marksAO1=8, AO2=8, AO3=4Methods in context
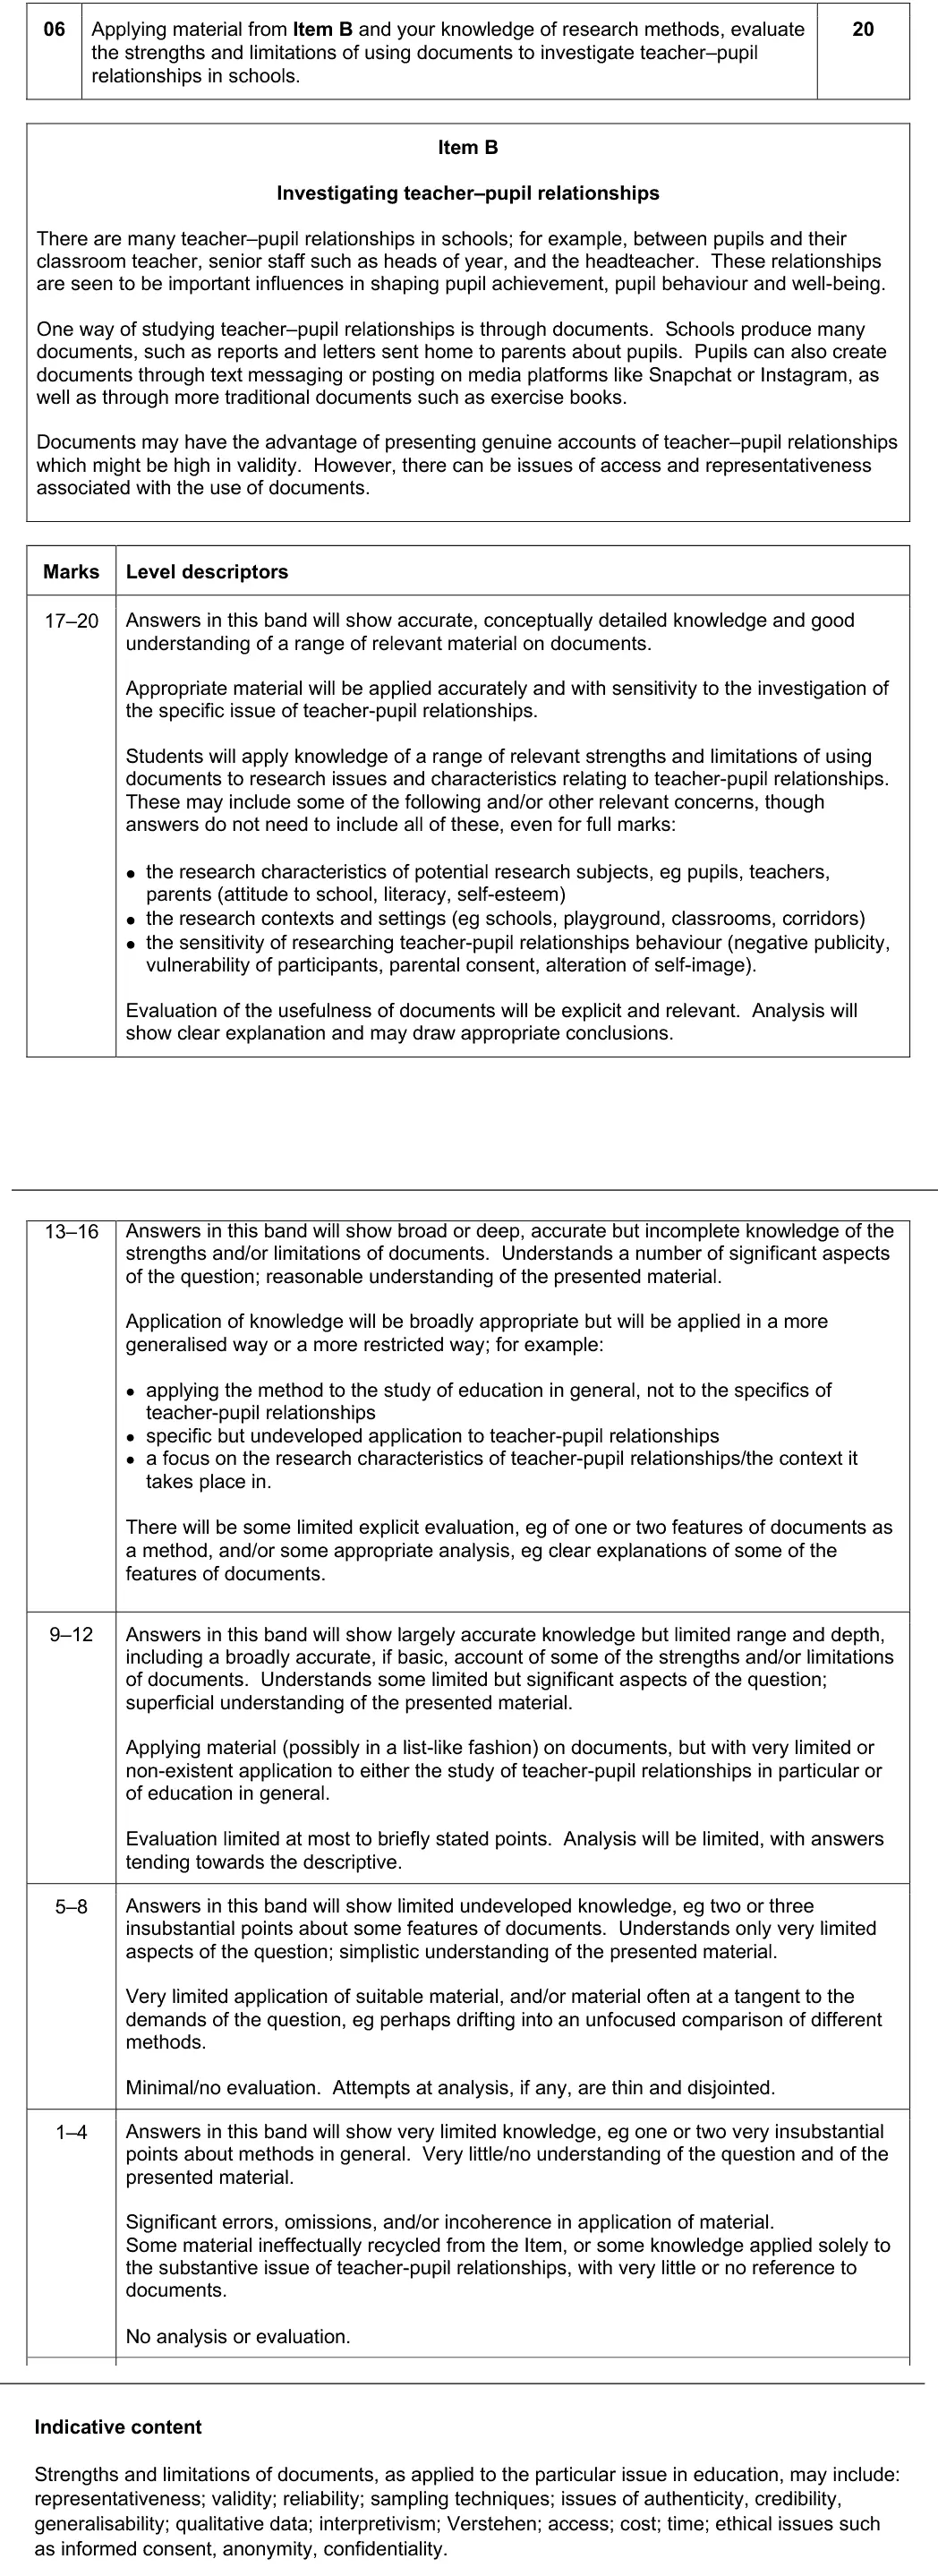
Mark scheme, including the levels grid and indicative content
Examiner's comment
This question was generally answered competently by most students, though only up to a certain point. A notable proportion demonstrated a lack of understanding regarding the secondary nature of documents. Several responses appeared to rely on pre-learned material concerning research in education that was relevant only to primary methods. As these points were not applicable to secondary sources, they could not be credited. Additionally, some students showed limited understanding of the nature of documents and the processes by which they are compiled and collected, despite the item offering some guidance in this regard. Nevertheless, a number of students produced rich, detailed, and varied responses that effectively addressed the suitability of using documents to investigate educational issues. The most advanced responses not only engaged critically with the item but also extended the discussion to the study of teacher–pupil relationships, incorporating prompts from the item and introducing further relevant methodological considerations.
Notes from the mark scheme and report
must apply the method to the specific issue (teacher–pupil relationships)
application to education in general only caps at 13–16
little or no reference to documents = max 4
many did not grasp that documents are secondary data and used primary-method points that could not be credited
best answers used item hooks (validity, access, representativeness, school and pupil-made documents)
June 2025 · Paper 3 · Q510 marksAO1=5, AO2=3, AO3=2Outline and explain
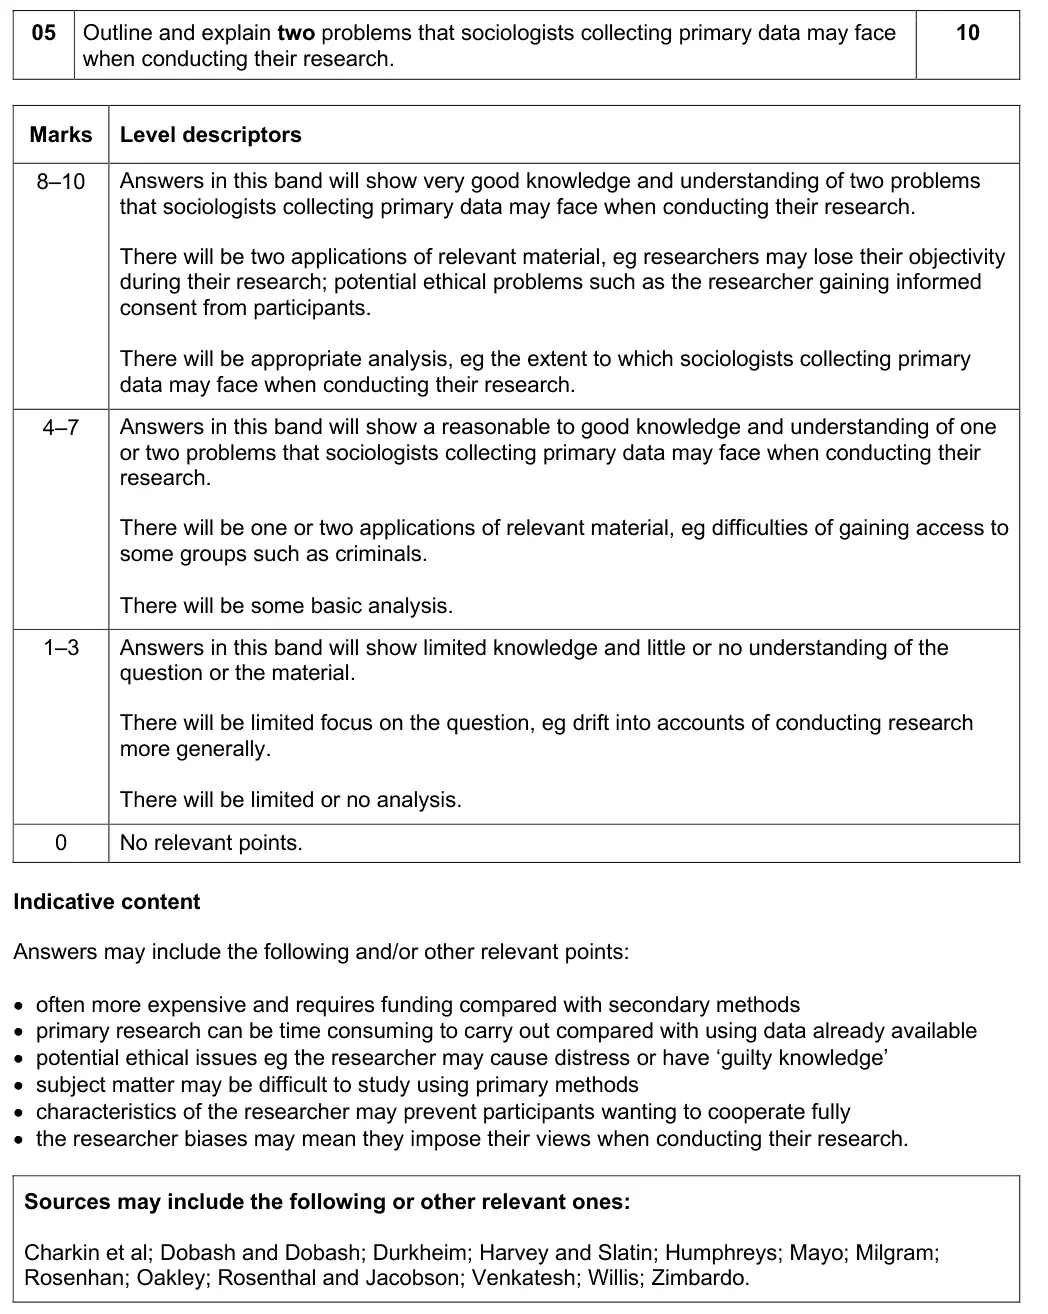
Mark scheme, including the levels grid and indicative content
Examiner's comment
Question five presented mixed responses. Students who did less well found it hard to keep to just two problems and accounts of validity drifted off into access or representativeness. Students needed to focus on the question set and find two problems with primary methods. Students who performed well gave a problem and were able to link this to a relevant primary research method. They were also able to give an example of a study such as Milgram or Oakley to further illustrate their point.
Notes from the mark scheme and report
no marks for evaluation in this question type
two problems each developed, e.g. loss of objectivity, ethical issues such as informed consent or guilty knowledge, access, cost and time
best answers linked each problem to a specific primary method and a study (Milgram, Oakley)
weaker answers drifted from validity into access or representativeness and could not keep to two
June 2024 · AS Paper 1 · Q620 marksAO1=8, AO2=8, AO3=4Methods in context
Mark scheme, including the levels grid and indicative content
Examiner's comment
Question 06: This question was answered well up to a point by most students. A significant proportion did not understand the secondary nature of official statistics. Some seemed to be bringing up pre-learned responses about researching in education that only applied to primary methods. The fact that these did not apply to secondary methods meant that they could not be rewarded. Others did not really understand the nature of official statistics and how they are collated and collected. The item did give some hints concerning this. Despite this, some students deployed rich, detailed and varied responses that dealt with the applicability of using official statistics to examine issues in education. The most sophisticated responses developed and applied this to the issue of studying disruptive pupil behaviour sometimes developing item prompts and also thinking of further issues.
Notes from the mark scheme and report
must apply official statistics to disruptive pupil behaviour specifically
education in general caps at 13–16
many did not grasp that official statistics are secondary data and recycled pre-learned points about primary research in schools
item hooks: truancy recorded by all schools, validity and reliability issues
June 2023 · AS Paper 2 · Q14 marksAO1=2, AO3=2Outline
Mark scheme
Examiner's comment
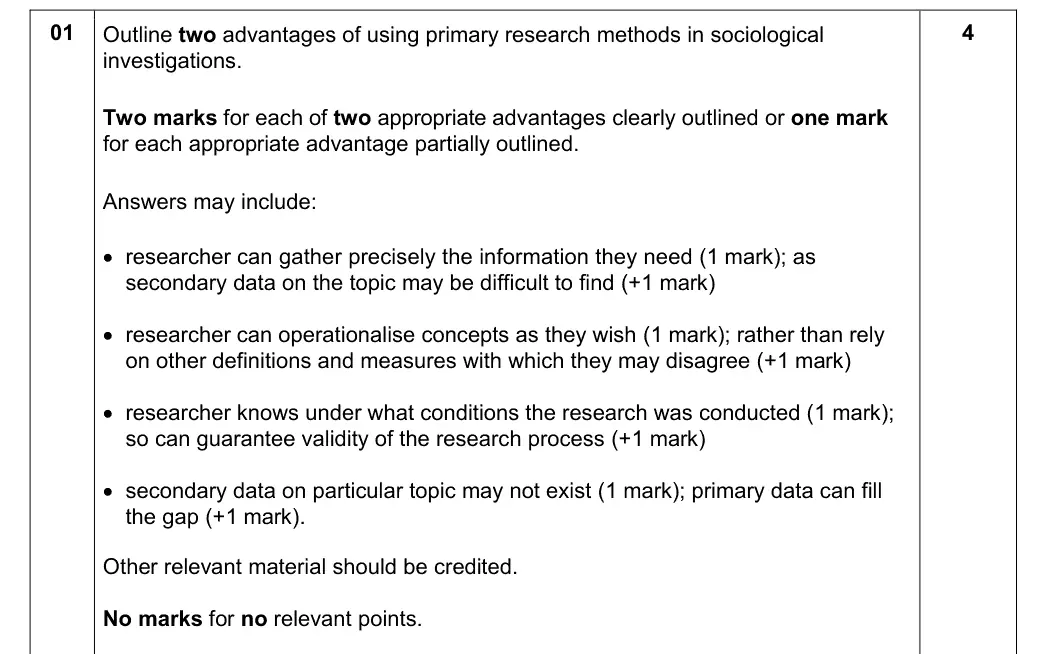
Students generally understood the difference between primary and secondary data. Some were less adept at identifying the advantages of such data. Students who claimed that primary sources were more valid; reliable; representative were required to explain how this is the case to gain credit as such qualities could equally be a feature of secondary sources of data. More successful responses were able to use the fact that the researcher was in control over the entirety of the research process to formulate effective answers.
Notes from the mark scheme and report
2 marks for each of two advantages clearly outlined, 1 if partial (e.g. researcher gathers exactly what is needed, operationalises concepts their own way, knows how the data were produced, fills gaps where no secondary data exist)
bare claims that primary data are more valid, reliable or representative need explaining, since secondary data can share these qualities
best answers stressed the researcher's control of the whole process
November 2021 · Paper 1 · Q520 marksAO1=8, AO2=8, AO3=4Methods in context
Mark scheme, including the levels grid and indicative content
Examiner's comment
However, there was generally a lower quality and standard of answers in comparison to previous normal summer entries with a number of students finding Q1 and Q5 more difficult in particular. However, a small number of students left questions unanswered (particularly question 5 and/ or 6). Similarly to previous years, some students wrote lengthy answers to the 4-mark and 6-mark questions which may explain why a few of these students seemed to run out of time in answering the final question(s). Unfortunately, students generally struggled with this question. Despite the prompts provided in the item, many students seemed to view ‘secondary data’ as being exclusively about secondary quantitative data or official statistics. Therefore, there were many assertions and generalisations made about secondary quantitative data that were applied and generalised to all secondary data. For example, a number of students referred to (all) secondary data as being high in reliability and low in validity, with generalised, and (often) inaccurate explanations. Stronger answers were able to draw out the strengths and limitations of the different types of secondary data types available in comparing the strengths and limitations of official statistics, for example, with the range of more qualitative documents that are available within schools. Unfortunately, a small number of students devoted large sections of their answers to discussions of alternative methods which were rarely creditworthy (unless they were used as a comparison to exemplify strengths and limitations of secondary data). There were some attempts at explaining and discussing issues with studying education more generally. For example, some explained the difficulties of accessing some school documents (such as exercise books and pupil reports) due to the different gatekeepers’ permissions needed. Unfortunately, there were only a very small number of responses that made attempts at developing and applying the strengths and limitations of using secondary data to study the specific issue ie the academic progress in schools. For example, while using league tables of exam results will enable the researcher to look for correlations and trends between the progress of pupils between schools, they do not provide any detail of the reasons why the pupils may or may not have made progress, to the various experiences they have outside of schools . However, knowledge and skills in the methods in context and Theory & Methods questions were generally weaker than previous series. It appeared that students had prepared less well for these topics and questions.
Notes from the mark scheme and report
must apply the method to the specific issue (academic progress of pupils)
application to education in general caps at 13–16
many treated all secondary data as official statistics and asserted high reliability, low validity
best answers contrasted quantitative (exam statistics, league tables) with qualitative school documents (reports, pupils' work) and gatekeeper access
long discussion of alternative methods rarely credited
November 2020 · AS Paper 1 · Q620 marksAO1=8, AO2=8, AO3=4Methods in context
Mark scheme, including the levels grid and indicative content
Notes from the mark scheme and report
must apply documents to working-class pupils' experiences of school specifically
education in general caps at 13–16
little or no reference to documents = max 4
item offers school-produced, pupil-produced and online documents and flags representativeness and validity
no examiners' report for this series
November 2020 · Paper 1 · Q610 marksAO1=5, AO2=3, AO3=2Outline and explain
Mark scheme, including the levels grid and indicative content
Examiner's comment
However, a few students left questions unanswered (particularly Question 6). Similarly to summer 2019, a significant number of students wrote very lengthy answers to the 4-mark and 6-mark questions which may explain why some seemed to run out of time in answering the final question. Unfortunately, students performed less well on this question compared with the rest of the paper. Many were able to offer two problems of primary qualitative methods, usually referring to practical issues of time taken and costs involved. However, few were able to develop their ideas with any real depth and analysis. A common problem with many answers was confusing and conflating theoretical issues of validity and reliability. A large number of responses seemed to mix or list points together in a confused way. For example, some confused problems of sampling and not being able to generalise with theoretical issues of reliability and/or validity in a rather random way. However, knowledge and skills in the Methods in Context and Theory and Methods questions were generally weaker than in previous series. It appeared that students had prepared less well for these topics and questions.
Notes from the mark scheme and report
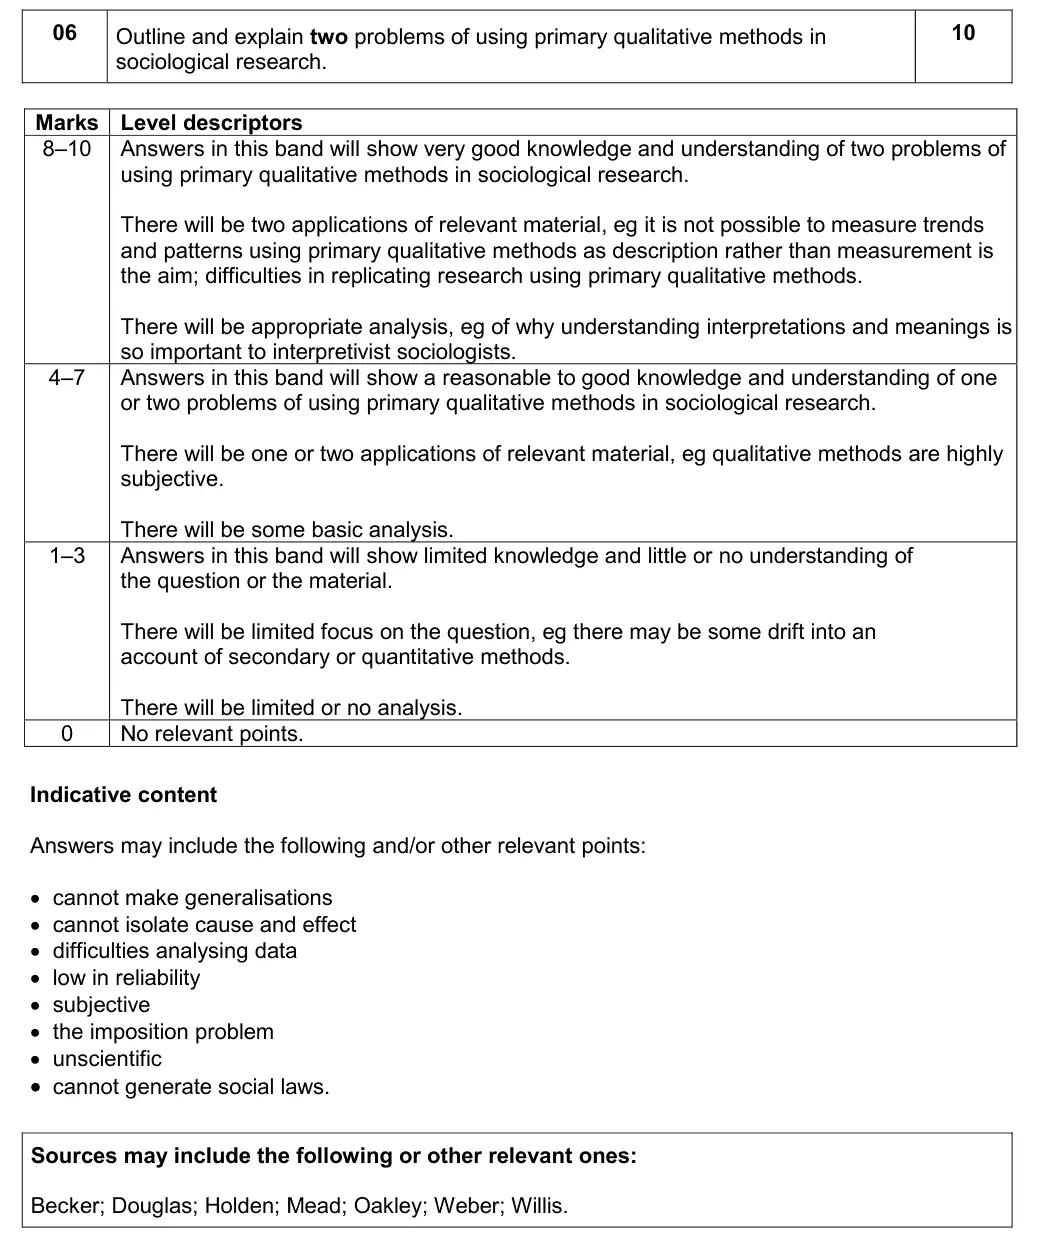
no marks for evaluation in this question type
two problems each developed (e.g. cannot measure trends or generalise, hard to replicate, subjectivity, imposition, cannot establish cause and effect)
drift into secondary or quantitative methods = 1–3
most gave only practical time and cost problems with little depth
validity and reliability often confused or conflated with sampling and generalisability
June 2018 · AS Paper 1 · Q620 marksAO1=8, AO2=8, AO3=4Methods in context
Mark scheme, including the levels grid and indicative content
Examiner's comment
The most important factor in answering this question successfully was the extent to which students applied their understanding of official statistics to the specific issue of investigating how successful a school is. However, some students were content on simply presenting strengths and limitations of the method without applying them to the issue in the question. Students generally found this method problematic and had a limited range of points. There was a high incidence of students recycling the item, particularly on official statistics allowing the researcher to see ‘patterns and trends’ and enabling ‘comparisons between schools’. Very few students were able to develop these ‘hooks’ both in terms of the methods and applying them to the issue in the question. This was also the case for the weakness stated in the item ‘which may not capture fully the experiences of the life of the school’. However, many students were able to relate this to official statistics lacking validity. Other responses presented some generic research characteristics of investigating education, such as that head teachers may wish to protect the reputation of the school. However, a large number of students discussed this in terms of official statistics being a primary method (e.g. references to pupils and teachers not wanting to fill out questionnaires). Better responses were able to apply this as a strength of official statistics in that the researcher does not have to face the problems of access or ethical issues that can apply to primary methods. The most successful answers were able to apply a characteristic of successful schools to the method of official statistics to reach the requirements of the top band. For example, some explained the problem of definitions used in official statistics to measure ‘successful schools’ has changed (such as the move from A*-C to Progress 8) meaning that comparisons over time cannot be easily made. Others explored ways that schools might manipulate the statistics by not entering students for the exams or the way that schools can hide attendance issues to make the school appear more successful and therefore not valid.
Notes from the mark scheme and report
must apply official statistics to the specific issue of measuring school success
education in general caps at 13–16
recycling item hooks (trends and patterns, comparisons between schools) without development was common
treating official statistics as a primary method (pupils filling in questionnaires) misses the point
best answers used changing measures (A*–C to Progress 8) undermining comparisons over time and schools manipulating statistics
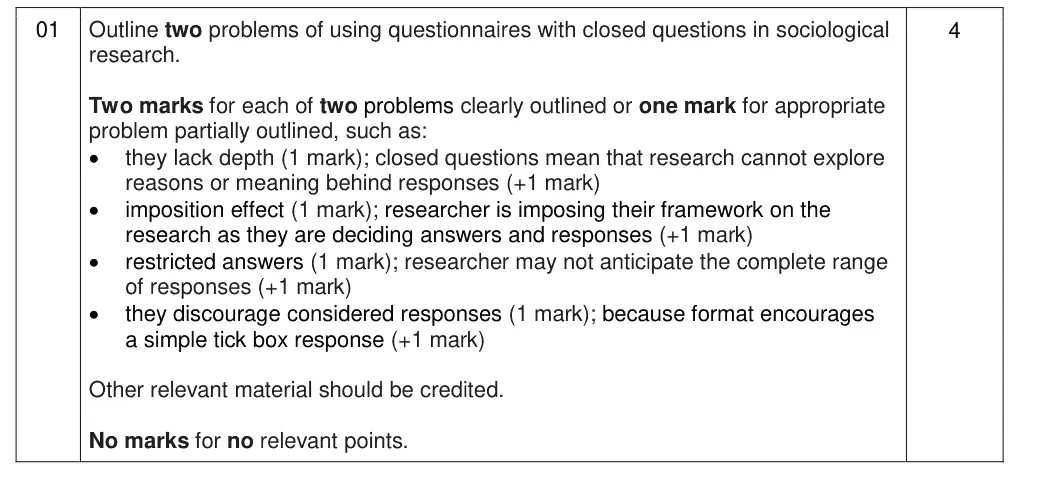
June 2018 · AS Paper 2 · Q14 marksAO1=2, AO3=2Outline
Mark scheme
Examiner's comment
Students who recognised that the key to this question was the idea of closed questions were largely successful. The most common responses then explored the lack of depth or the restricted answers that closed questions generate. Failure to elaborate was a factor in not getting the full marks. For example, answers that just said that one of the problems was that closed questions tended to produce quantitative data without elaborating on how or why that was a problem were credited as partial answers. There were a number of students who identified generic problems with questionnaires or of research in general and did not gain marks.
Notes from the mark scheme and report
2 marks for each of two problems clearly outlined, 1 if partially outlined
credited: lack of depth (no reasons or meanings), imposition of the researcher's framework, restricted answers the researcher did not anticipate, tick-box format discourages considered replies
problems must be specific to closed questions, generic questionnaire or research problems gained nothing
saying it gives quantitative data without explaining why that is a problem = partial
AO split from AQA's standard grid for this paper (this year's mark scheme does not print it).
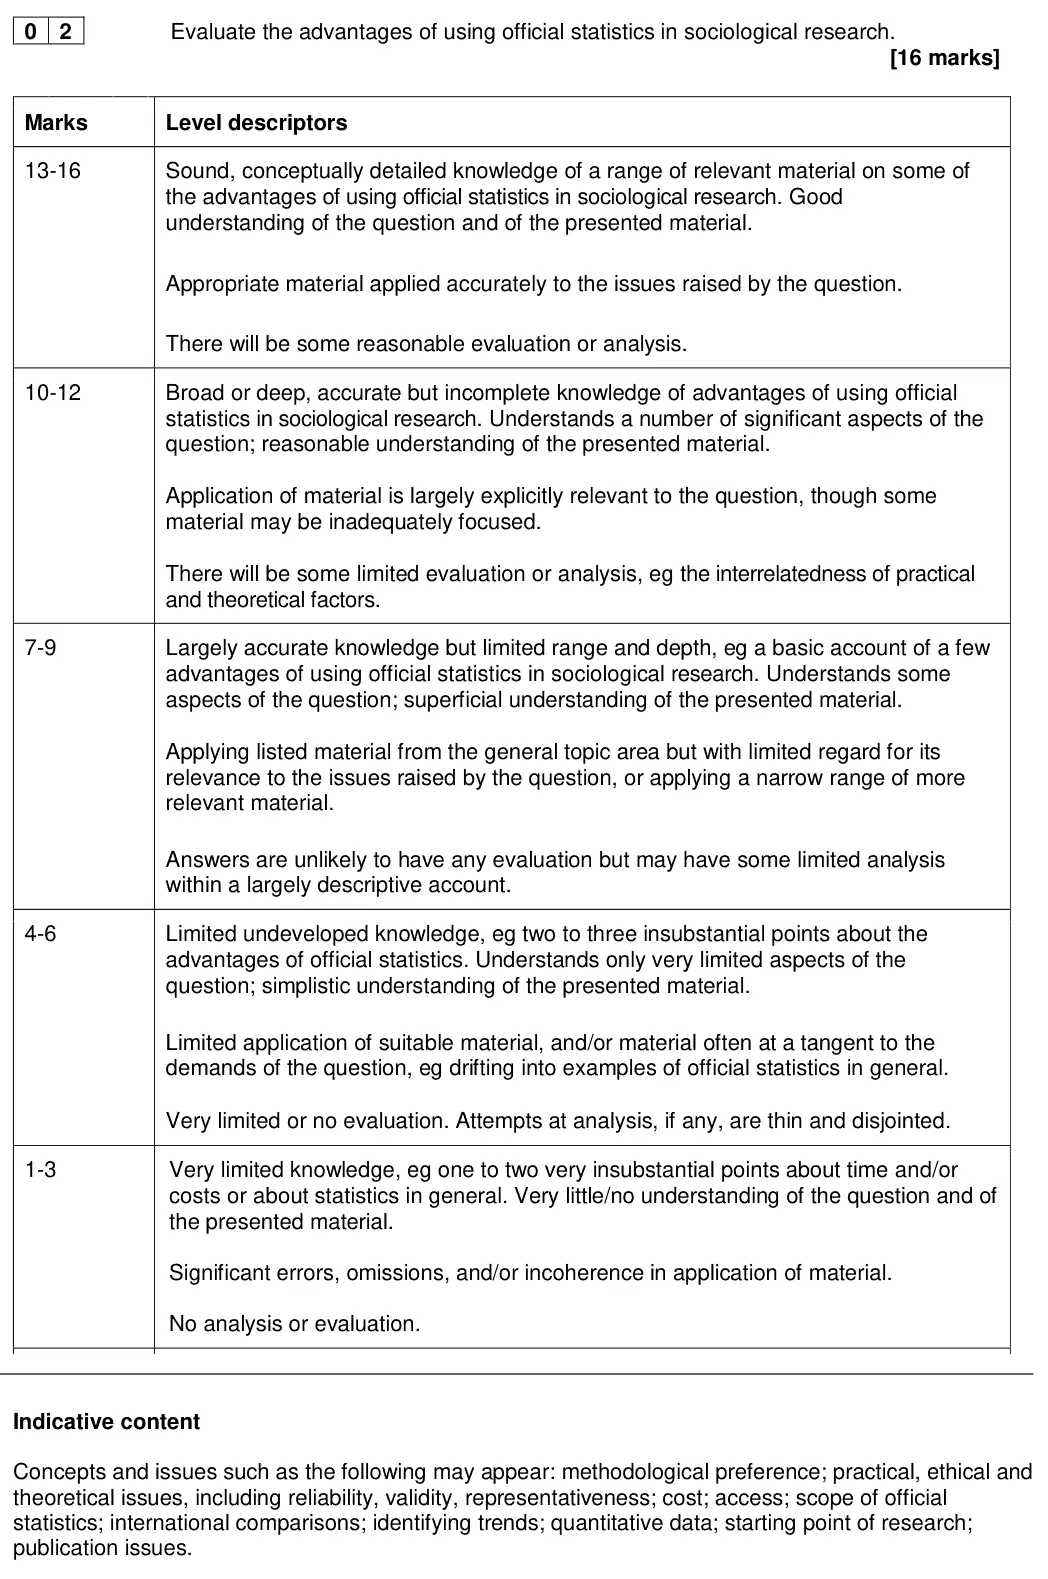
June 2016 · AS Paper 2 · Q216 marksAO1=6, AO2=5, AO3=516-mark essay
Mark scheme, including the levels grid and indicative content
Examiner's comment
Many students followed a practical, ethical and theoretical factors framework, but there was often confusion over the theoretical concepts, especially reliability and validity. Many simply listed advantages and then disadvantages, showing little awareness of evaluation. Students often used phrases such as 'positivists like quantitative data because it's reliable' without any real development or sense that they understood what that meant. Better answers showed good knowledge and understanding of official statistics, and developed the response through examples and analysis. Strong responses were also able to evaluate those advantages explicitly rather than just juxtaposing a disadvantage, for example: ‘official statistics had the ethical advantage of informed consent for the original data, but the participants were not aware of its use for further sociological research’, or: ‘although official statistics generated large amounts of data, this might mean problems of complex and lengthy analysis’.